GM Web Resources
We are part of a large team made up of designers, developers, marketers, researchers, analysts, and strategists.
Sharing information is essential to what we do.
Have a question?
We’re here whenever you need us.
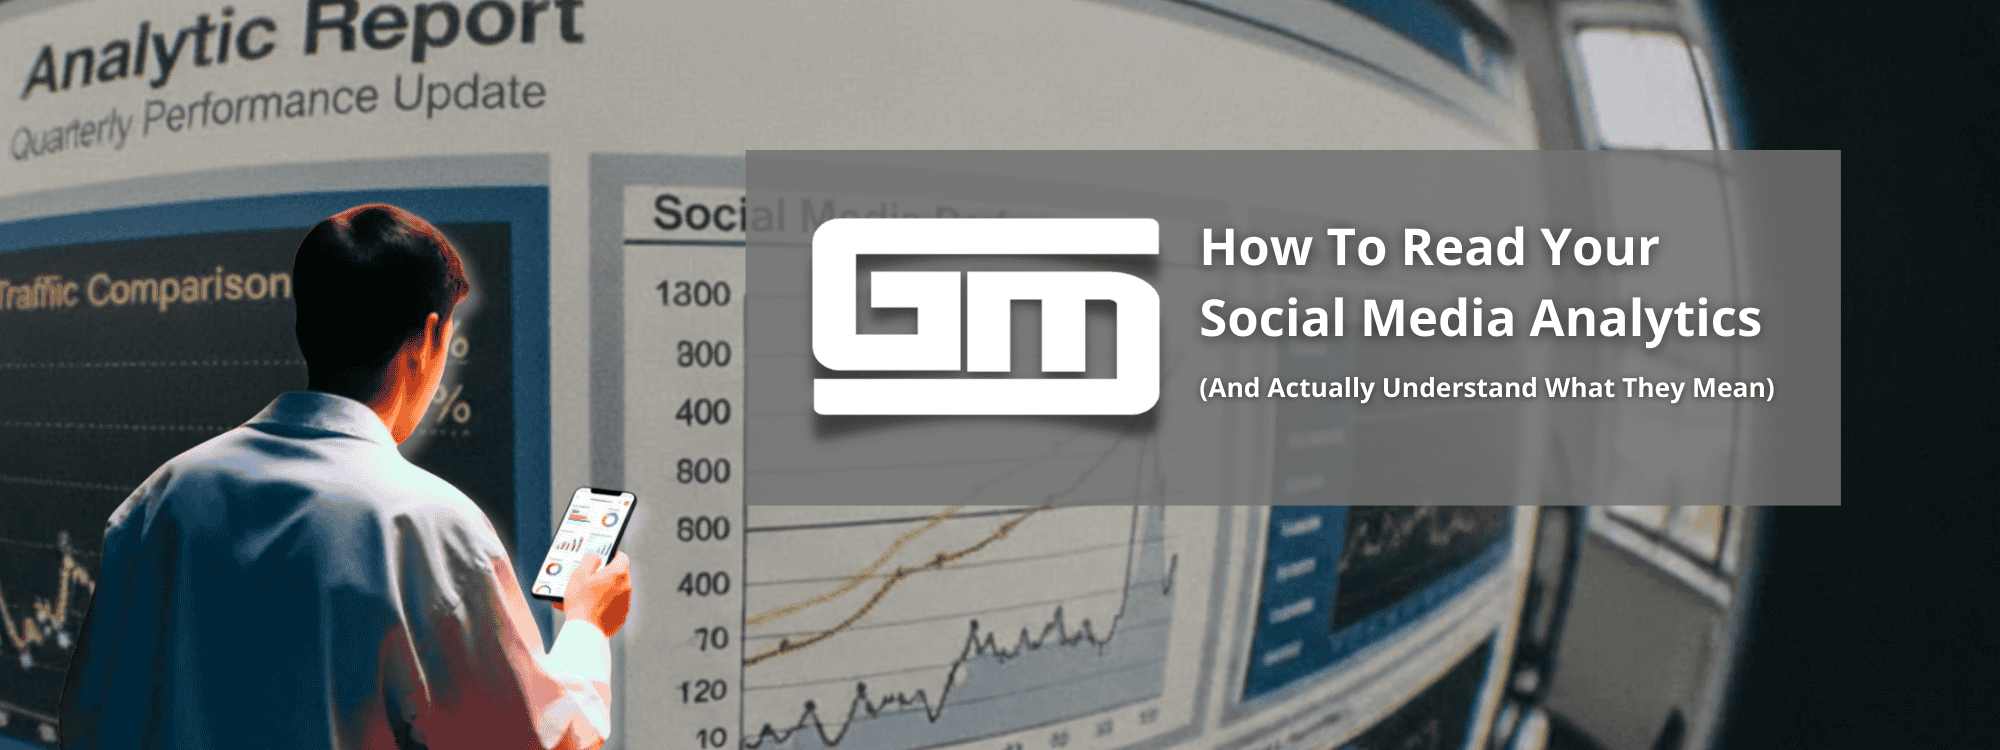
How To Read Your Social Media Analytics (And Actually Understand What They Mean)
At GM Web Services, we send monthly social media analytics to all of our social media clients. Not because it’s “nice to have,” but because reporting is one of the most important parts of an effective digital strategy. Analytics tell the story behind your growth, your engagement, and your overall online presence.
But for many business owners, analytics dashboards can feel overwhelming, full of charts, percentages, and numbers that don’t immediately translate into useful information.
This guide breaks everything down in a clear, practical way. Think of it as your “How To Read Your Report” walkthrough, written so anyone can follow along and make smarter decisions for their business.
1. Start With the Overview: What Changed This Month?
Most social media reports begin with a high-level summary:
- Total followers
- Total reach
- Total impressions
- Total posts
- Engagement numbers
This section quickly shows the direction your accounts are heading. For example:
- Did followers increase or stay steady?
- Did reach improve, drop, or hold?
- Was there a spike tied to a specific post or date?
A month-over-month comparison is especially helpful because social media fluctuates naturally. Having those numbers side-by-side gives context and prevents overreacting to normal shifts.
Reach and Impressions: The “Visibility” Metrics
These are two of the most important metrics for understanding how many people see your content.
A Note on Growth Expectations
More posting generally means faster growth. Most small businesses post one to two times per week, which absolutely works, but results will be steadier and slower.
Frequent posting widens your opportunity for reach and impressions, so growth typically speeds up with increased consistency and volume.
3. Engagement Metrics: Are People Interacting With Your Content?
Engagement is where the quality of your content becomes clear. Engagement includes:
An increase in engagement means your content is hitting the mark. A decrease doesn’t necessarily mean your content is poor, it may simply mean your audience wasn’t online as much, the post types were different, or fewer posts were published.
Engagement Rate
This is the percentage of people who engaged with your content compared to how many saw it.
A healthy engagement rate varies by platform, but generally:
• 2–3 percent is solid
• 3–5 percent is strong
• 6 percent and above is excellent
Engagement rate is one of the most important indicators that your audience is paying attention.
Top Performing Posts: Your Most Important Insights
This is one of the best sections in your monthly report, the breakdown of what actually worked.
Typically, this section includes:
These posts reveal patterns you should pay attention to:
• Certain topics may consistently perform well
• Carousels might outperform single-image posts
• Reels may generate more reach than graphics
• Educational content might outperform purely promotional content
Every top-performing post teaches you something about what your audience finds valuable.
5. Google Analytics and Website Traffic: The Bigger Picture
Many reports include website metrics such as:
This tells you how well your social media strategy supports your website. Even posting just a few times a week can drive consistent traffic to key pages like services, blogs, or contact forms.
Why Reporting Matters (And Why We Include It Every Month)
Analytics give you:
- Real insight into what’s working
- A clear view of your growth pattern
- Guidance on what to change
- Evidence of your marketing investment
Direction for new content
At GM Web Services, we include monthly analytics for our clients because reporting is not optional, it’s essential. The data guides your content, helps set realistic expectations, and keeps your strategy moving in the right direction.
Reporting Helps You Make Better Decisions
Social media reporting isn’t about chasing big numbers; it’s about understanding the story behind your growth. When you know how to read the insights, you can spot opportunities, adjust strategy, and create content that resonates with your audience.
And when your reporting is consistent, your growth becomes consistent too.